Reporting, Dashboards and Export
Reporting works in three layers. The console carries a dashboard and a set of reports that are ready to use. Any of those reports can be filtered, exported, or scheduled to arrive by email. And the underlying logs can be streamed to an external analytics platform, which is where an organisation builds dashboards and reports of its own design.
The dashboard
The dashboard opens on the platform's operating state: online gateways, online users, licensed user count against subscription, and the renewal date. Below it sit four panels - Top Data Usages, Top Time Usages, Anomalies by Type and Top Blocked Services - each with its own Today / Week / Month selector, so the same panel can be read over three different periods without leaving the page.
The reports
| Report | What it covers |
|---|---|
| Live Users · Live Gateways | Who and what is connected right now |
| Session Log | Connection sessions, with times |
| Access Log · Application Access Log · Portal Access Log | Which user reached which application, and when |
| Event Log | Configuration and system events |
| Login Failures | Failed authentication attempts |
| User Last Login Report | Last successful login per user |
| Data Usage · Time Usage | Consumption per user and per application |
| Risk Report | Users scored against their risk profiles |
| Network Test | Connectivity diagnostics |
| User · User Group · Devices · Gateways · Application Services · Access Policies · Application Groups | Inventory of what is configured |
Every report page carries the same controls: a period selector, a filter for the record type, a free-text search, page-size control, and a CSV button that exports what is on screen.

Scheduled delivery
Any combination of these reports can be scheduled to arrive by email - daily, weekly or monthly, at a chosen time and timezone, to a list of recipients. See Email Alerts and Scheduled Reports.
Export to an external analytics platform
This is the layer that answers custom dashboards and custom reports. Logs are exported to the organisation's own analytics or SIEM platform, where dashboards, correlations and reports are built to whatever specification is wanted, alongside data from other systems.
An export profile names the destination and what to send:
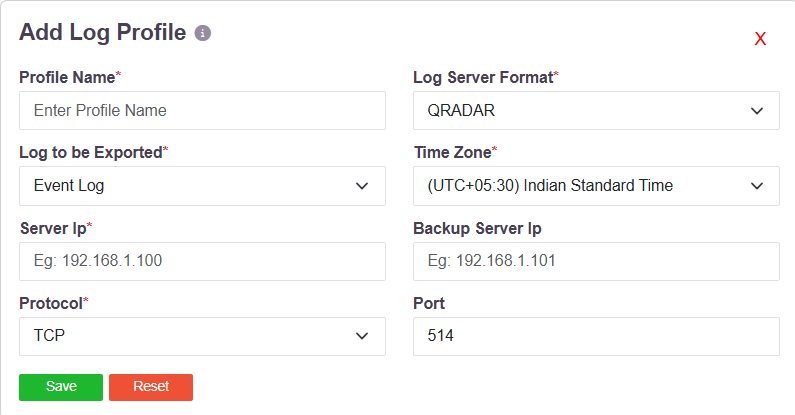
| Field | What it takes |
|---|---|
| Profile Name | A name for the profile |
| Log Server Format | QRADAR, ARCSIGHT, SPLUNK, SYSLOG, SCP, SFTP or EMAIL |
| Log to be Exported | Event Log, Session Log, or App Access Log |
| Time Zone | The timezone stamps are written in |
| Server Ip and Backup Server Ip | The destination, and a fallback |
| Protocol and Port | TCP or UDP, and the port - 514 by default |
The Log Server Format names the destination the profile is written for. It selects the delivery format the platform emits; it is not a promise that a particular collector's parsing or field mapping is configured for you. Where a collector expects records in a shape of its own, that mapping is set up on the collector, or agreed as part of the integration.
For streaming system events to a SIEM in Syslog or FTP/SFTP form, see Event Stream.
What this does and does not include
The console's dashboard and report set are fixed: they are configured and filtered, not designed in the console itself. Reporting an organisation wants in its own shape is built on the exported data, in the analytics or SIEM platform it already uses for that purpose.
Custom reports and dashboards can be prepared, based on the customer's requirement.